Story
How data choices shape our understanding of the ocean regions in a changing climate
19 February 2026
A new study by Plymouth Marine Laboratory (PML), assessing the consistency of machine-learning clustering methods applied to complex three-dimensional ocean model outputs, reveals that results can differ depending on what data you choose, with major implications for managing our marine environment in a changing climate.
Cloud free Europe. European Space Agency
The global ocean is an incredibly complex environment and as monitoring technology advances, there has been a dramatic increase in the amount of oceanic data being collected. While this wealth of information is valuable, sectoral analysis capability is still limited and the scientific community has been investigating artificial intelligence and machine-learning techniques to help make sense of extremely large and complicated environmental datasets.
Ocean datasets comprise multiple variables, such as depth, latitude, longitude and time. To draw useful conclusions from these massive ocean datasets, such as predictions of the future carbon cycle, researchers often simplify these datasets by dividing the ocean into regions with similar physical, biogeochemical, ecological or economic characteristics.
Choosing the most appropriate way to subdivide an area into spatial regions for analysis can be challenging. Regions selected following the borders of national jurisdictions often do not reflect boundaries or events in the physical or biogeochemical properties, for example, ocean thermal fronts. Trends can also be missed in the simplification process and therefore, misleading conclusions can be drawn.
With this in mind, ‘clustering’ has been increasingly used by researchers as a way of letting the data draw its own boundaries, grouping parts of the ocean that behave similarly, rather than relying on political borders or historical conventions. However, a better understanding of clustered outputs is vital if this approach is to be of true value to policy development and management of the marine environment, especially in light of widespread environmental change.
To explore the consistency of clustering when different input data are used, the study team applied machine-learning clustering algorithms to a high-resolution 3D ocean model dataset, from PML’s world-renowned European Regional Sea Ecosystem Model (ERSEM) coupled to the hydrodynamic model Nucleus for European Modelling of the Ocean (NEMO), and compared results generated using physical, biogeochemical and ecological variables at different water depths.
The findings showed that the resulting spatial clusters varied depending on whether the input data came from physical properties, such as temperature and salinity, versus biogeochemical or ecological variables. Physical-based clusters tended to spread latitudinally, while biogeochemical and ecological clusters were more coastal and locally concentrated. Depth also affected patterns, with clusters based on surface data differing from those based on depth-averaged or near-bottom data.
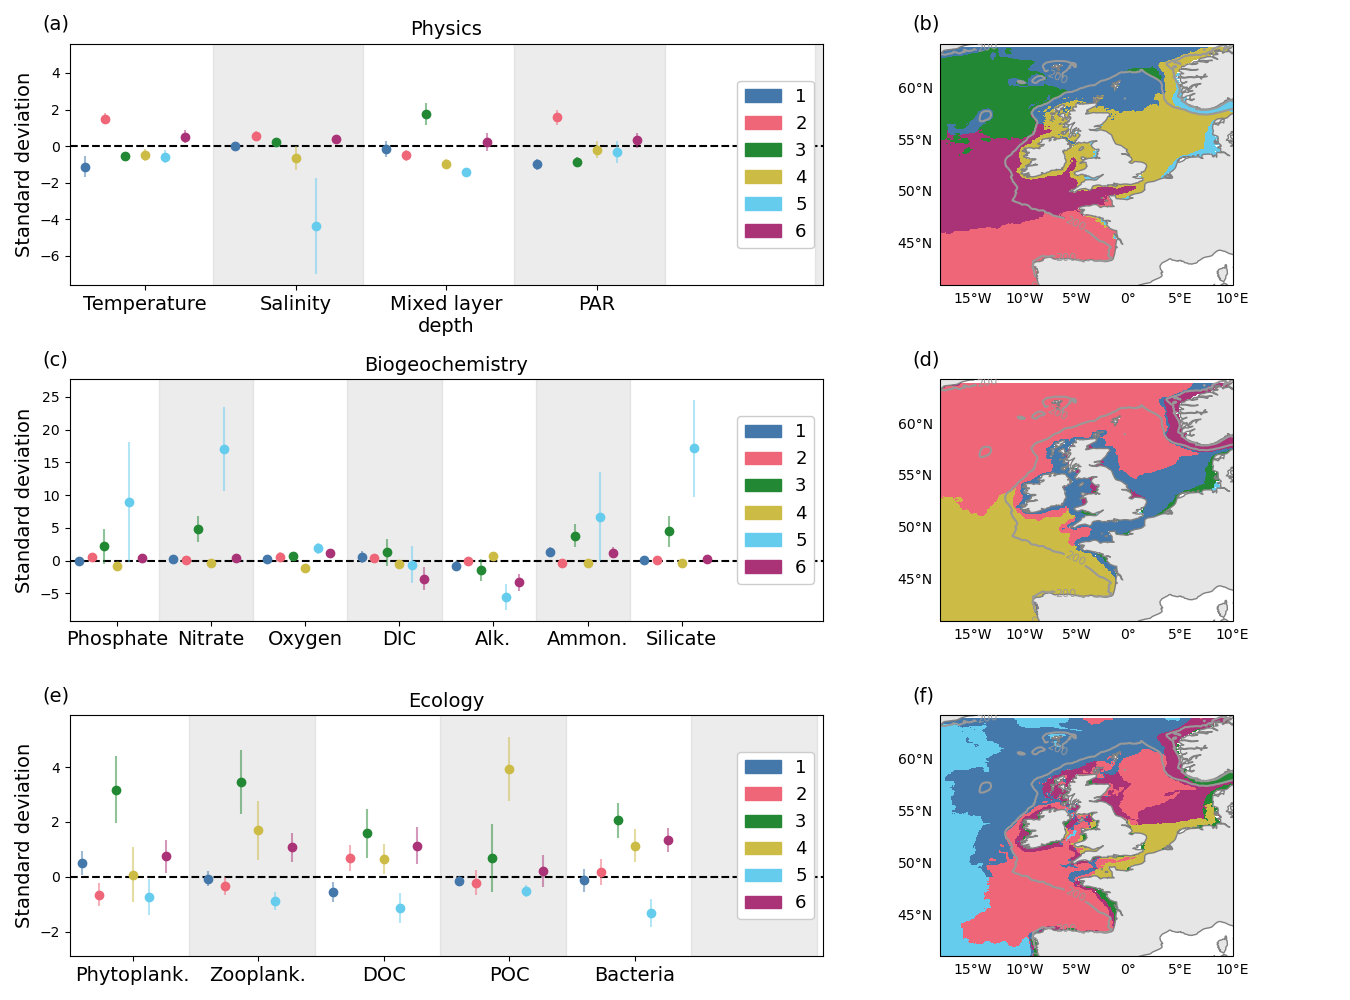
Despite these differences, there were similarities in broad spatial distribution patterns, such as smaller clusters near coastlines and larger, more extensive clusters offshore. This suggests that clustering can identify meaningful oceanographic structures but the specific features identified depend on what data are used.
By showing that clustering results can differ significantly depending on the input variables and depth, the research highlights important considerations for scientists using machine-learning to characterise ocean regions. This matters for climate research, marine resource management and ecological forecasting, since accurate identification of marine areas, such as biologically significant regions, has direct implications for fisheries, conservation and climate models.
This research is useful guidance for other scientists using similar methods in Earth and environmental sciences that will help them avoid misleading conclusions based on inconsistent clustering results.
Dr Rebecca Millington, lead author and Ecosystem Modelling Scientist at Plymouth Marine Laboratory, commented:
“This study shows that machine-learning techniques can highlight meaningful spatial zones in ocean datasets but variability across different inputs needs careful consideration. These results offer a foundation for choosing appropriate variable sets when identifying regions of similar ocean properties, relevant for ecosystem modelling, marine management and climate research. However, we emphasise the need for careful documentation of data preprocessing and variable choice in complex environmental clustering studies.”
“We hope that this work can help other scientists who are new to using this particular machine-learning technique. We have included all of our code and data in a repository online to help make this technique more accessible.”
The study was undertaken by the Environmental Intelligence Group at PML, and funded by the UK National Capability Project FOCUS and the NERC Single Centre National Capability Programme Atlantic Climate and Environment Strategic Science (AtlantiS). This work also benefitted from internal funding provided by PML.
Related information
Full paper: Consistency of clustering analysis of complex 3D ocean datasets