Story | 22 September 2026
Sewage-linked bacteria traced from source to Devon beaches and shellfish farms expose gaps in pollution monitoring
Scientists from Plymouth Marine Laboratory tracked Escherichia coli (E. coli) from source to sea in Plymouth Sound and Lyme Bay (Devon, UK) and found bacteria spiking on both wet and dry days, with coastal currents and not rain determining which beaches and shellfish beds got hit by the illness-causing bacteria.

Plymouth Sound. Trevor Burrows Aerials
Public and regulatory scrutiny has intensified in recent years on the topic of sewage discharges into UK rivers and coastal waters, as ageing infrastructure struggles to cope with increasingly erratic rainfall driven by climate change.
Water companies in England and Wales routinely release untreated or partially treated sewage from storm overflows. According to the Environment Agency, 2025 saw 291,492 spills totalling 1.87 million hours across England, and 46,164 spills totalling 407,006 hours across the south west region (Cornwall/Devon/West Dorset).
However, water quality monitoring is likely missing key health risk events. The current system of periodic sampling, rather than continuous monitoring, can easily fail to capture short-lived contamination spikes, with only around 5% of exceedance events being logged by routine testing schedules.
To compound the issue, many current systems used to warn the public about sewage pollution on UK beaches rely heavily on rainfall forecasts but new research from Plymouth Marine Laboratory (PML) shows that rain alone is a poor predictor of when and where bacterial contamination will strike the coast.
The study, published in Marine Pollution Bulletin, combined in-situ water sampling with advanced computer modelling to trace the journey of E. coli from rivers and sewage overflows to the beaches and shellfish farms of Devon’s Plymouth Sound and Lyme Bay; two areas that support a combined tourism, recreation and shellfish economy worth millions of pounds a year.
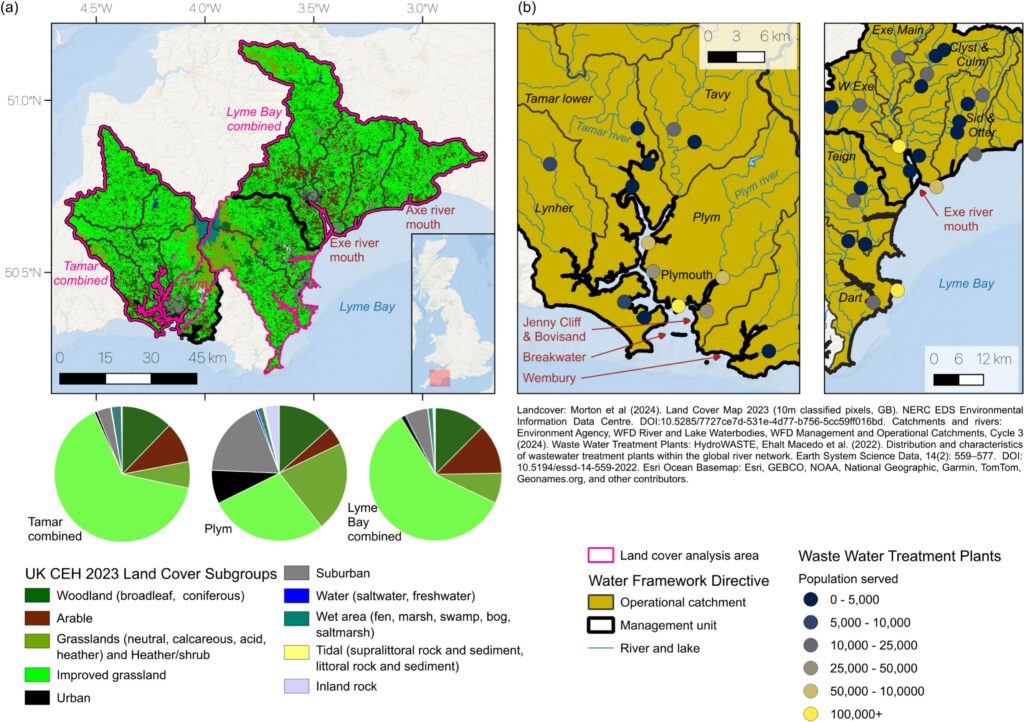
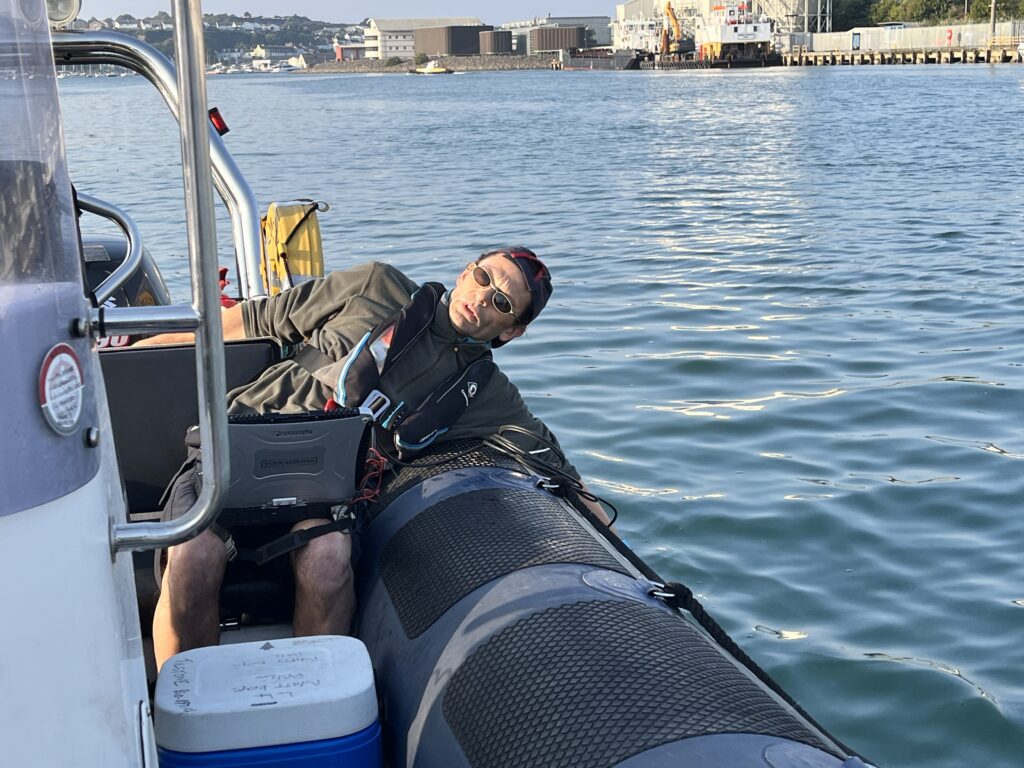
Dr Tilstone sampled water monthly from the River Tamar, River Plym and Plymouth Sound throughout 2024, then used a hydrodynamic ocean model (FVCOM) paired with a particle-tracking model (PyLag) to simulate exactly where bacteria released into rivers would travel once they reached the sea. This system factored in tides, wind and, critically, the direction and speed of surface currents.
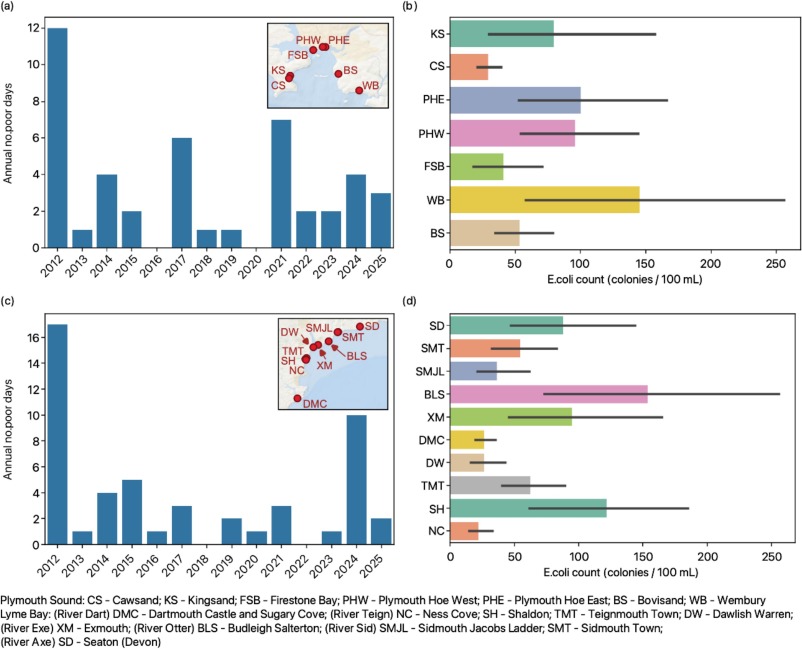
The results challenge assumptions built into existing water-quality forecasting. On 8 July 2024, a dry day before rainfall, E. coli counts at beaches around Plymouth were already elevated and well above the level considered “sufficient” bathing water quality.
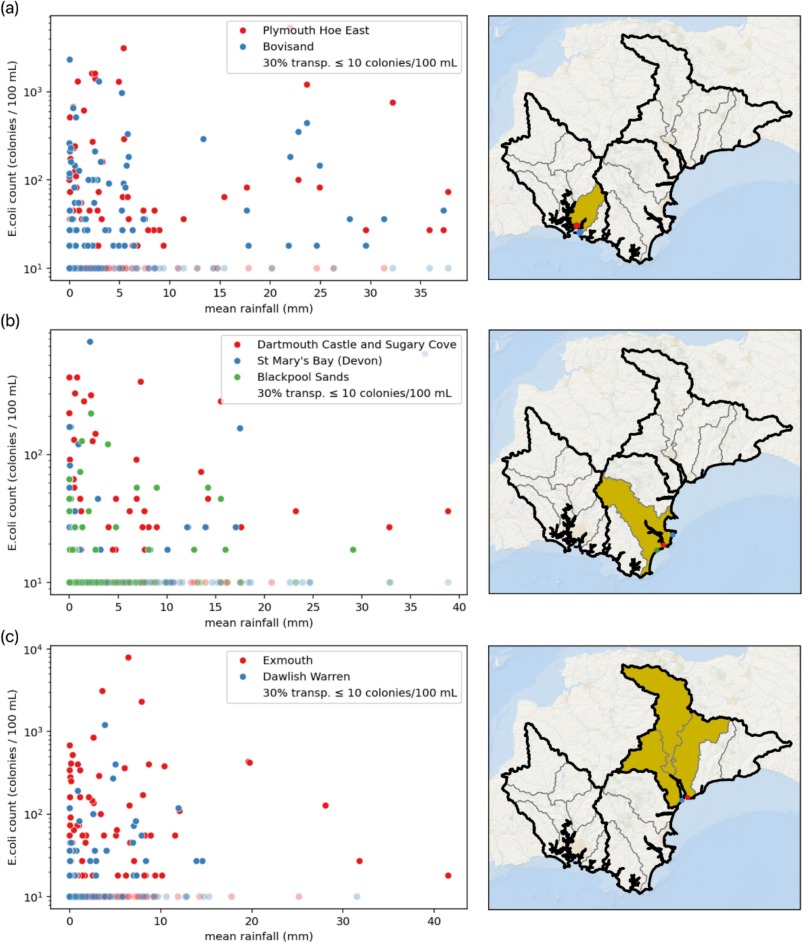
The mismatch was also reflected in the relationship between rainfall and bacteria levels across 13 years of data from three Devon river catchments, which showed no significant pattern at all and contamination spiked during both wet and dry periods alike.
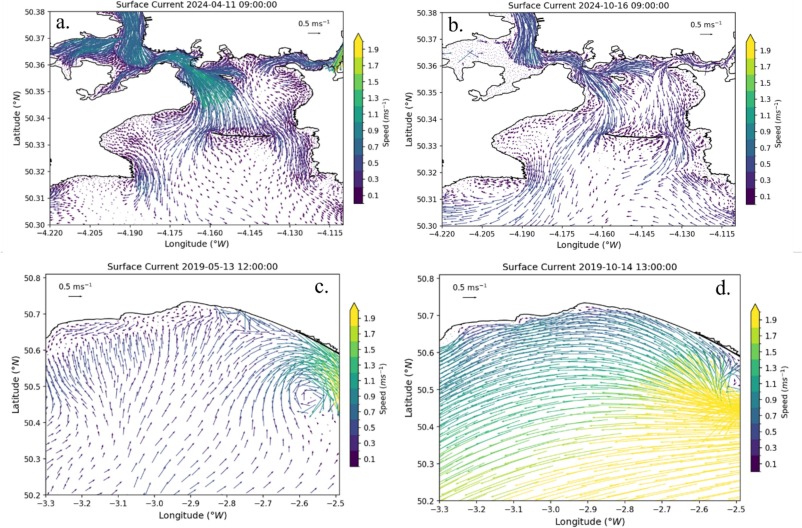
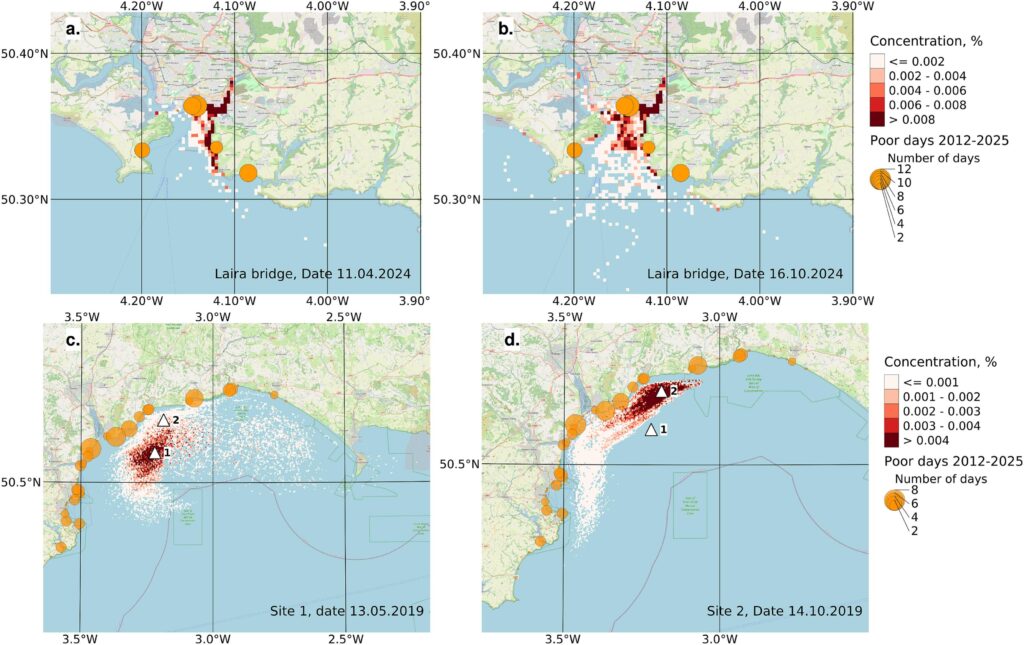
The modelling in the study revealed that coastal currents concentrated E coli at particular locations. When currents flowed one way, bacteria from the River Plym were funnelled east onto popular tourist beaches, including Jenny Cliff, Bovisand and Wembury. On other days, the same source instead reached the Breakwater and beaches to the west.
In Lyme Bay, the team traced two separate contamination events at an offshore mussel farm (May and October 2019) back to probable sewage discharges via combined sewer overflows on the rivers Exe and Dart more than 10km away. These events were serious enough to trigger a downgrading of the site’s shellfish safety classification, costing the business thousands in revenue and reputation.
Lead author and Bio-optical Oceanographer at Plymouth Marine Laboratory, Dr Gavin Tilstone, commented:
“Rainfall and river volume alone are not sufficient to forecast where E. coli contamination will end up, and coastal current direction is just as necessary. We found instances of poor water quality outside the official bathing season and even during dry weather, at a time when people are still swimming in these waters.”
Even beaches rated ‘excellent’ carry a measurable health risk and previous studies suggest 2.5–4% of bathers can still develop gastrointestinal illness at that standard. Coastal water swimmers are generally at higher risk of gut, ear, eye and respiratory infections than non-swimmers. The growing popularity of cold-water swimming outside the official bathing season (mid-May to September), when monitoring largely stops, adds to the exposure.
Dr Tilstone added:
“The current monitoring approach, based on occasional spot sampling and rainfall alone, is not capturing the full picture.”
The researchers recommend that hydrodynamic and particle-tracking models like the one used in this study should be integrated into a new generation of early-warning systems, combining real-time sensors, satellite data and current/tide forecasting. This would give the public and shellfish producers a genuine, location-specific picture of contamination risk, rather than relying on rainfall as a blunt proxy.
The authors caution that further work is needed to pin down other possible contributors to elevated bacteria levels, including agricultural run-off and seabird faeces. Also the modelling, while it corresponded well with independently recorded incidents of poor water quality, offers a probabilistic picture of contamination pathways rather than a real-time detection tool.
The study was funded by UK Research and Innovation Science and Technology Facilitating Council grant ‘Vis4Sea‘, the Natural Environment Research Council’s Regional Impact from Science of the Environment (NERC-RISE) initiative, the South-West Partnership for Environmental and Economic Prosperity (SWEEP) and the National Capability International programme funding, FOCUS.